One web UI per server
Each server shows only its own runs. Checking last night's failures on five servers means opening five web UIs.
Dagu Console · Beta
Connect your self-hosted Dagu servers to Dagu Console. Their health, runs, and trends show up on one set of pages, and you get an email when a workflow fails or a server stops reporting. Workflows keep running only on your servers.
Free for one server. Team and Pro cover every licensed server. Requires Dagu v2.19.1 or later; v2.19.2 or later for free monitoring.
Your servers
Workflows run here
Email when a workflow fails or a server stops reporting, and when it recovers
Each Dagu server is complete on its own, with its own scheduler, run history, and web UI. With several servers, that also means several places to check.
Each server shows only its own runs. Checking last night's failures on five servers means opening five web UIs.
Nothing collects the failures of all servers in one place, so nobody sees the whole picture.
A stopped scheduler or a server that went quiet raises no error. Scheduled workflows just stop running until someone notices.
Failure emails need mail and notification settings on every server, kept in step by hand.
The Monitoring section of Dagu Console has an Overview, Servers, Runs, Alerts, and Insights page, plus a page for each server and each workflow. Every member of the workspace can view them.
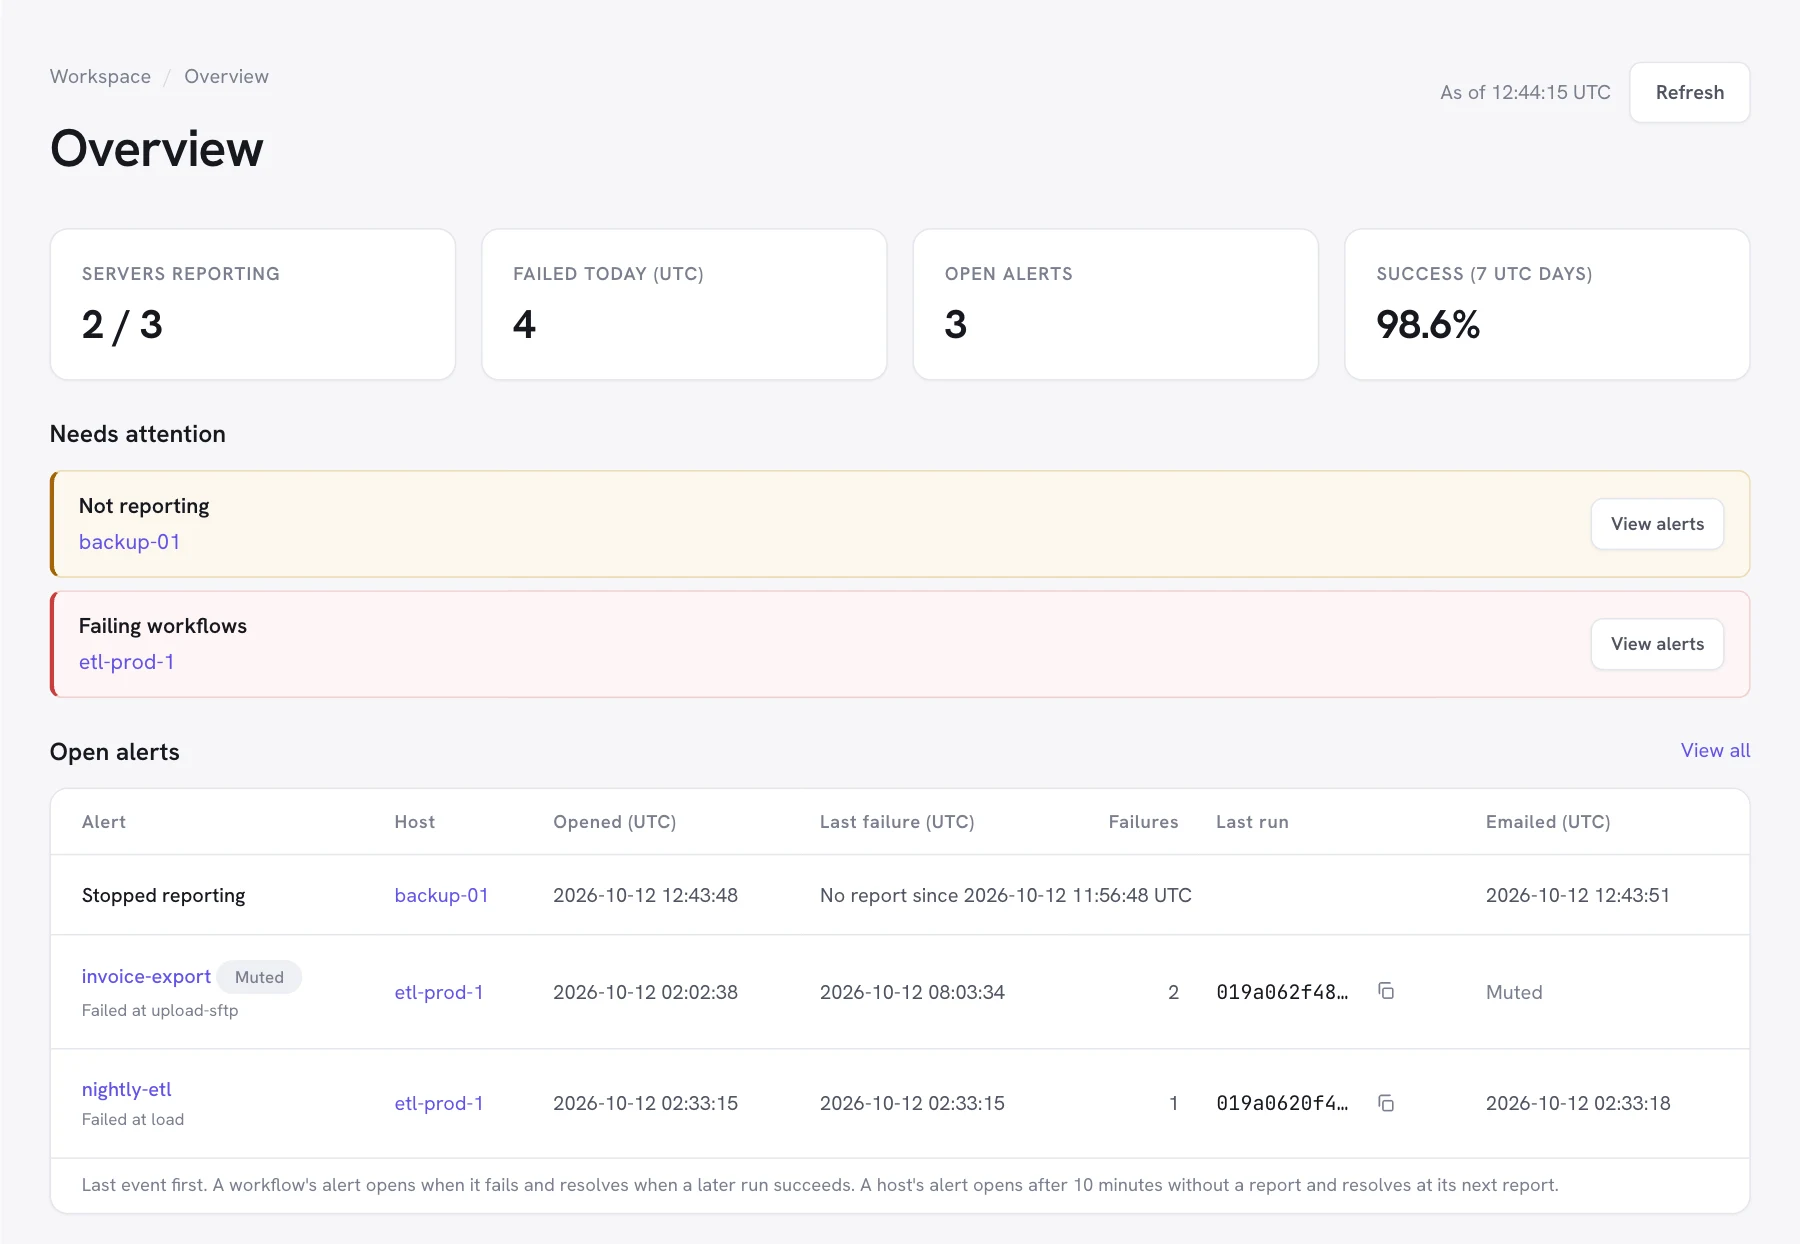
Servers reporting, failures today (UTC), open alerts, and the success rate over the last 7 UTC days. Needs attention lists each problem with the servers it affects.
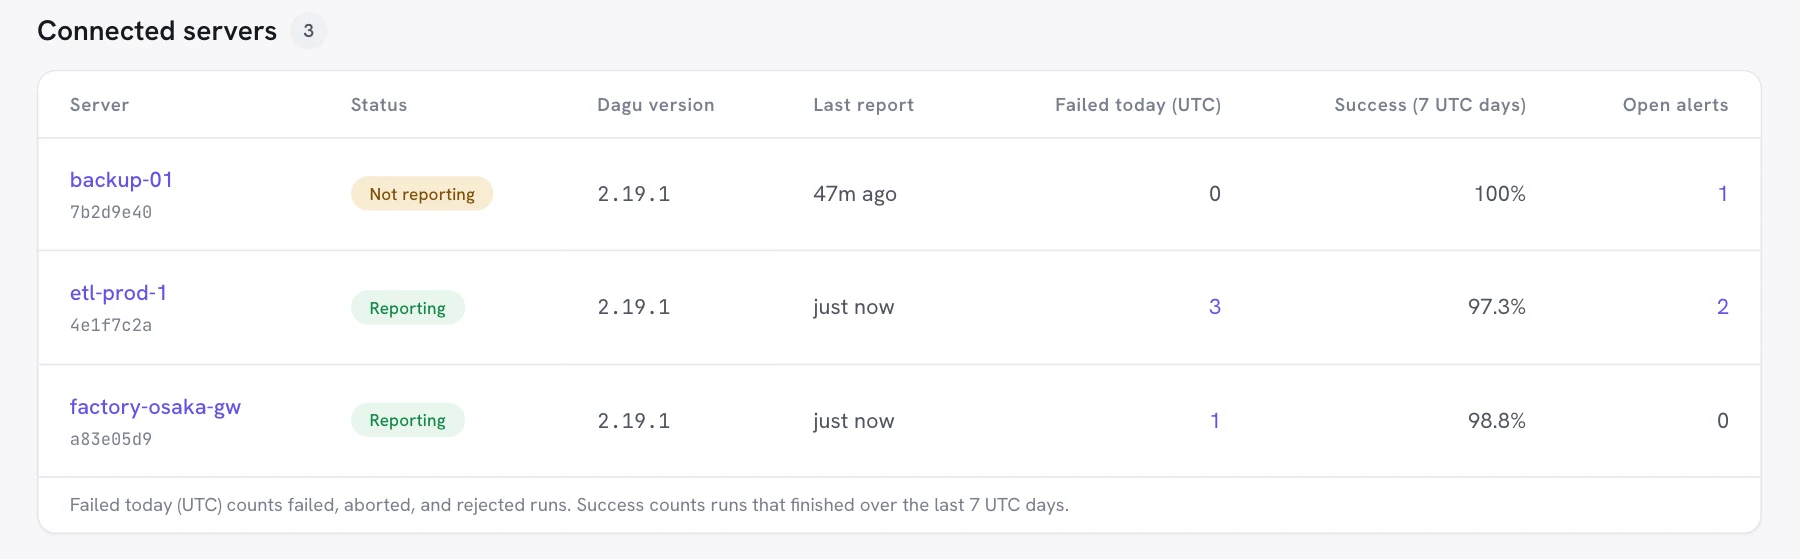
Each connected server with its status, Dagu version, last report, failures today (UTC), success rate over 7 UTC days, and open alerts.
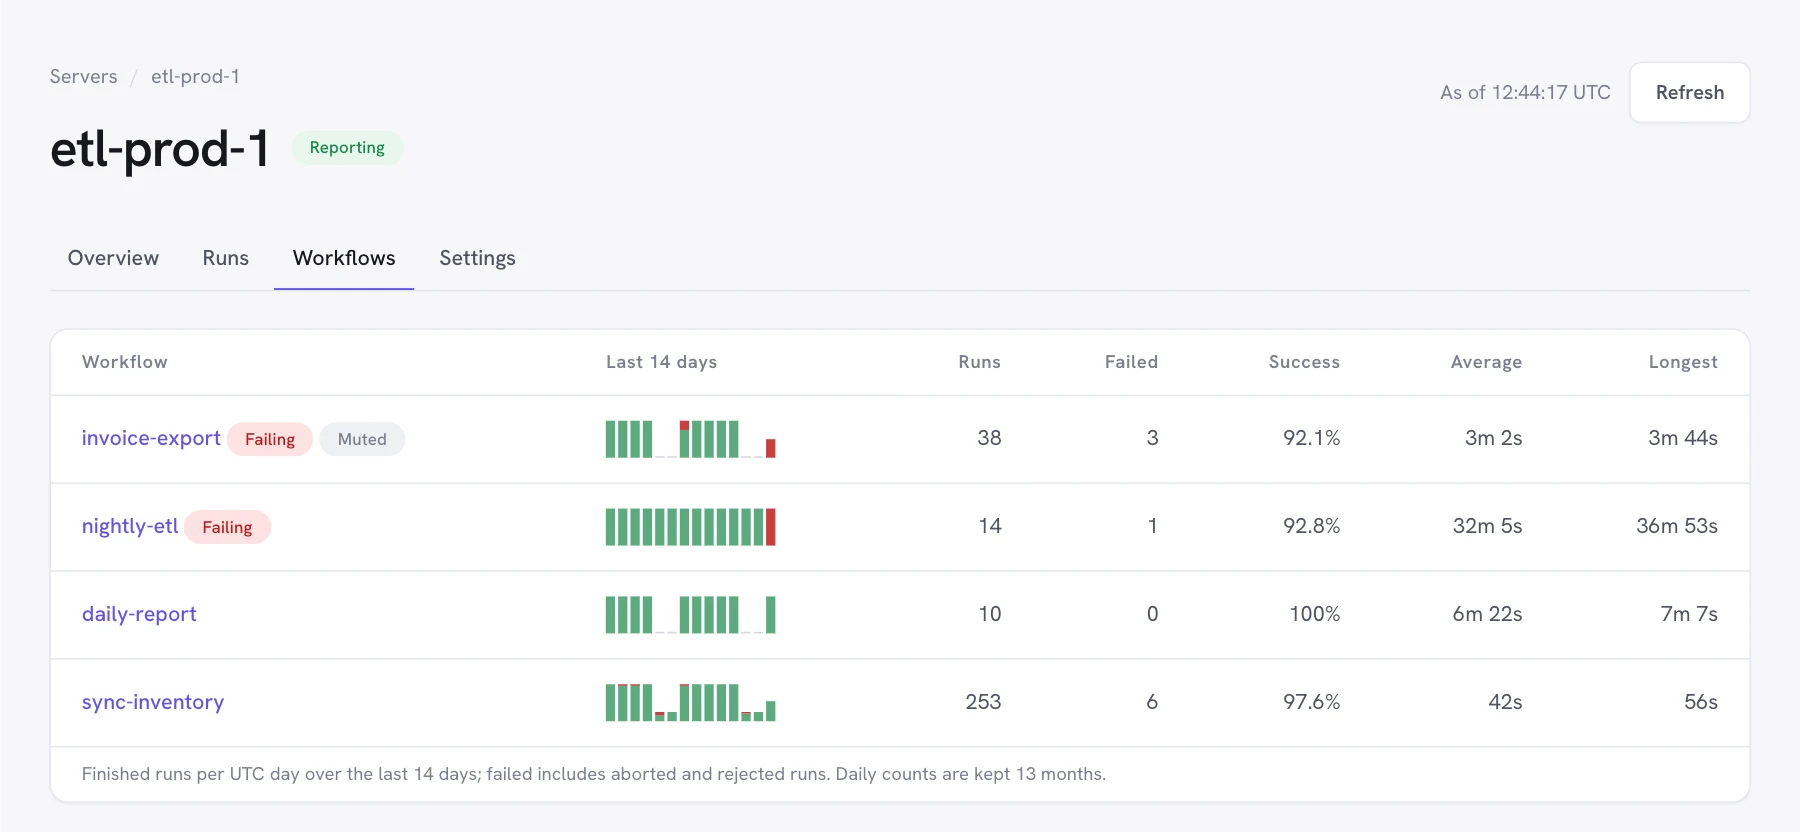
A page per server. Overview shows its health (Dagu version, OS and architecture, process start, last report, last check-in), the services from the last report, open alerts, and failures in the last 14 days. Runs lists its runs. Workflows shows each workflow's finished runs per UTC day over 14 days, with runs, failures, success rate, and average and longest duration.
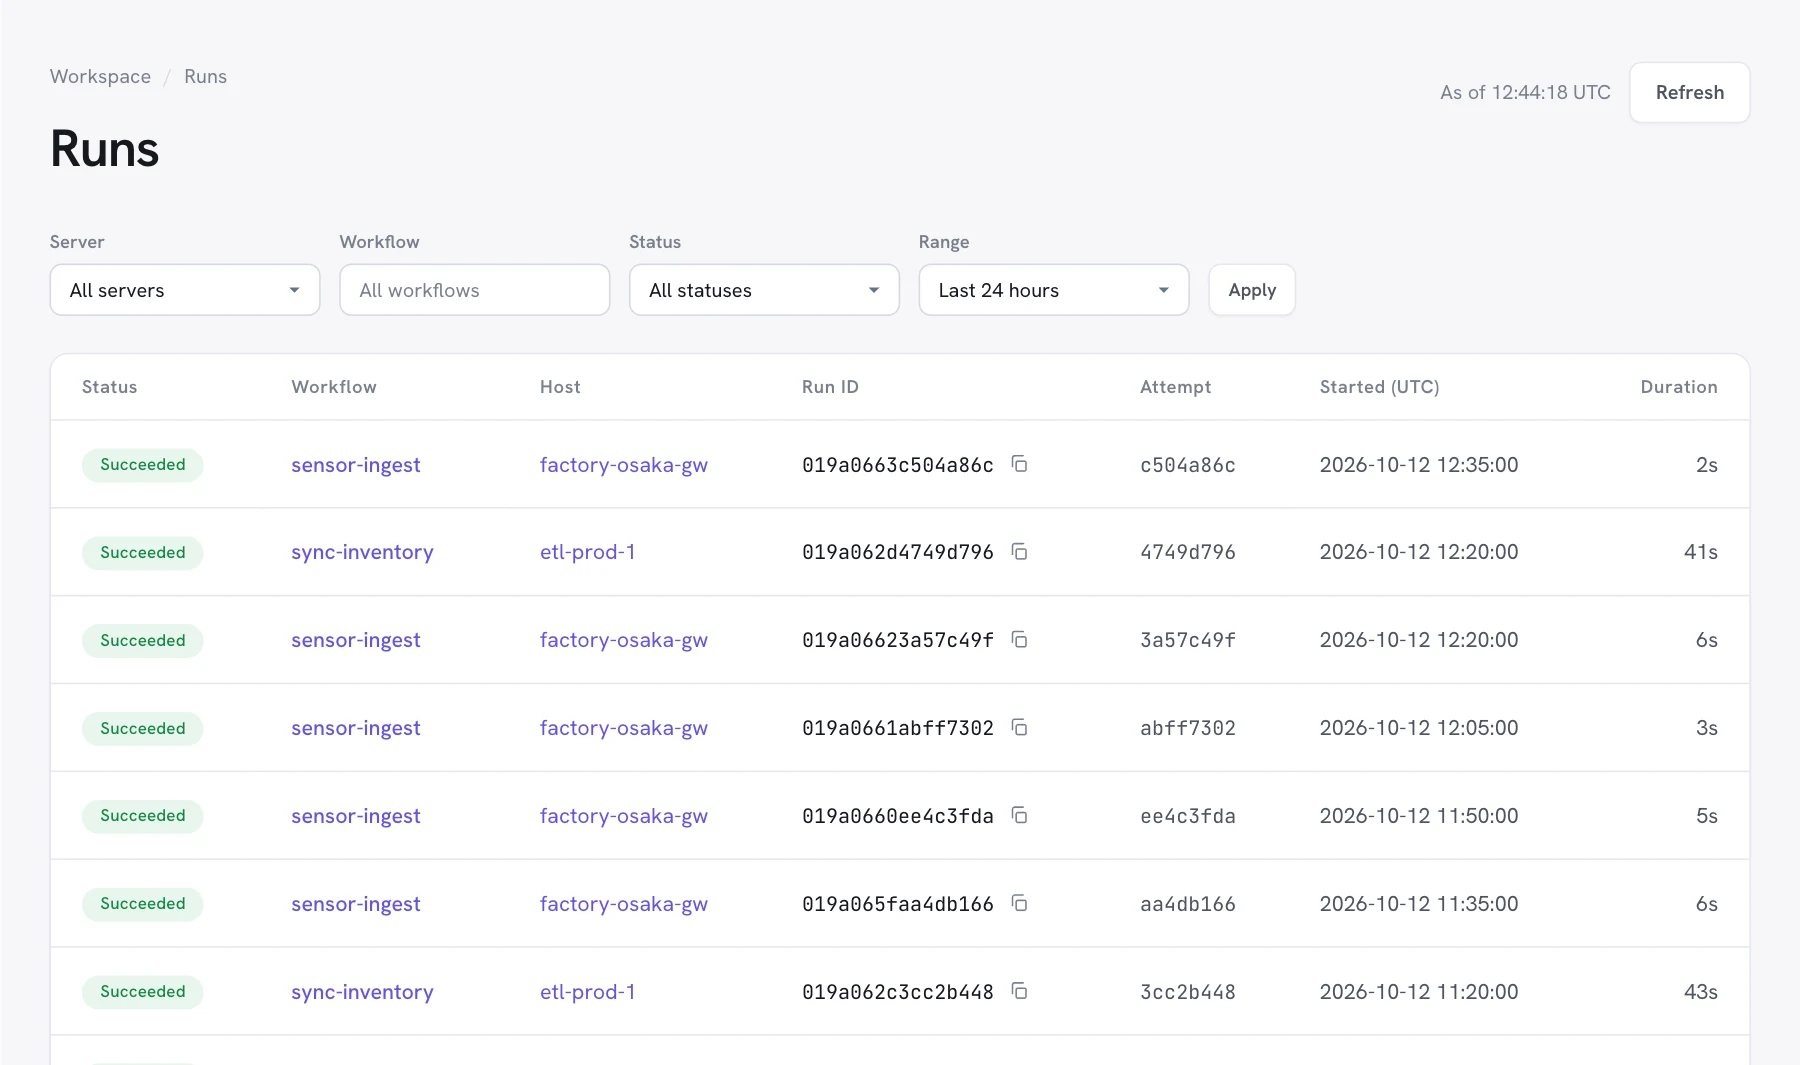
Runs in progress come first, then finished runs, newest first. Each run has a permalink to its attempts.
Filter by server, workflow, status (failed, succeeded, running, waiting, or queued), and range: the last hour, 24 hours, 7 days, or 14 days.
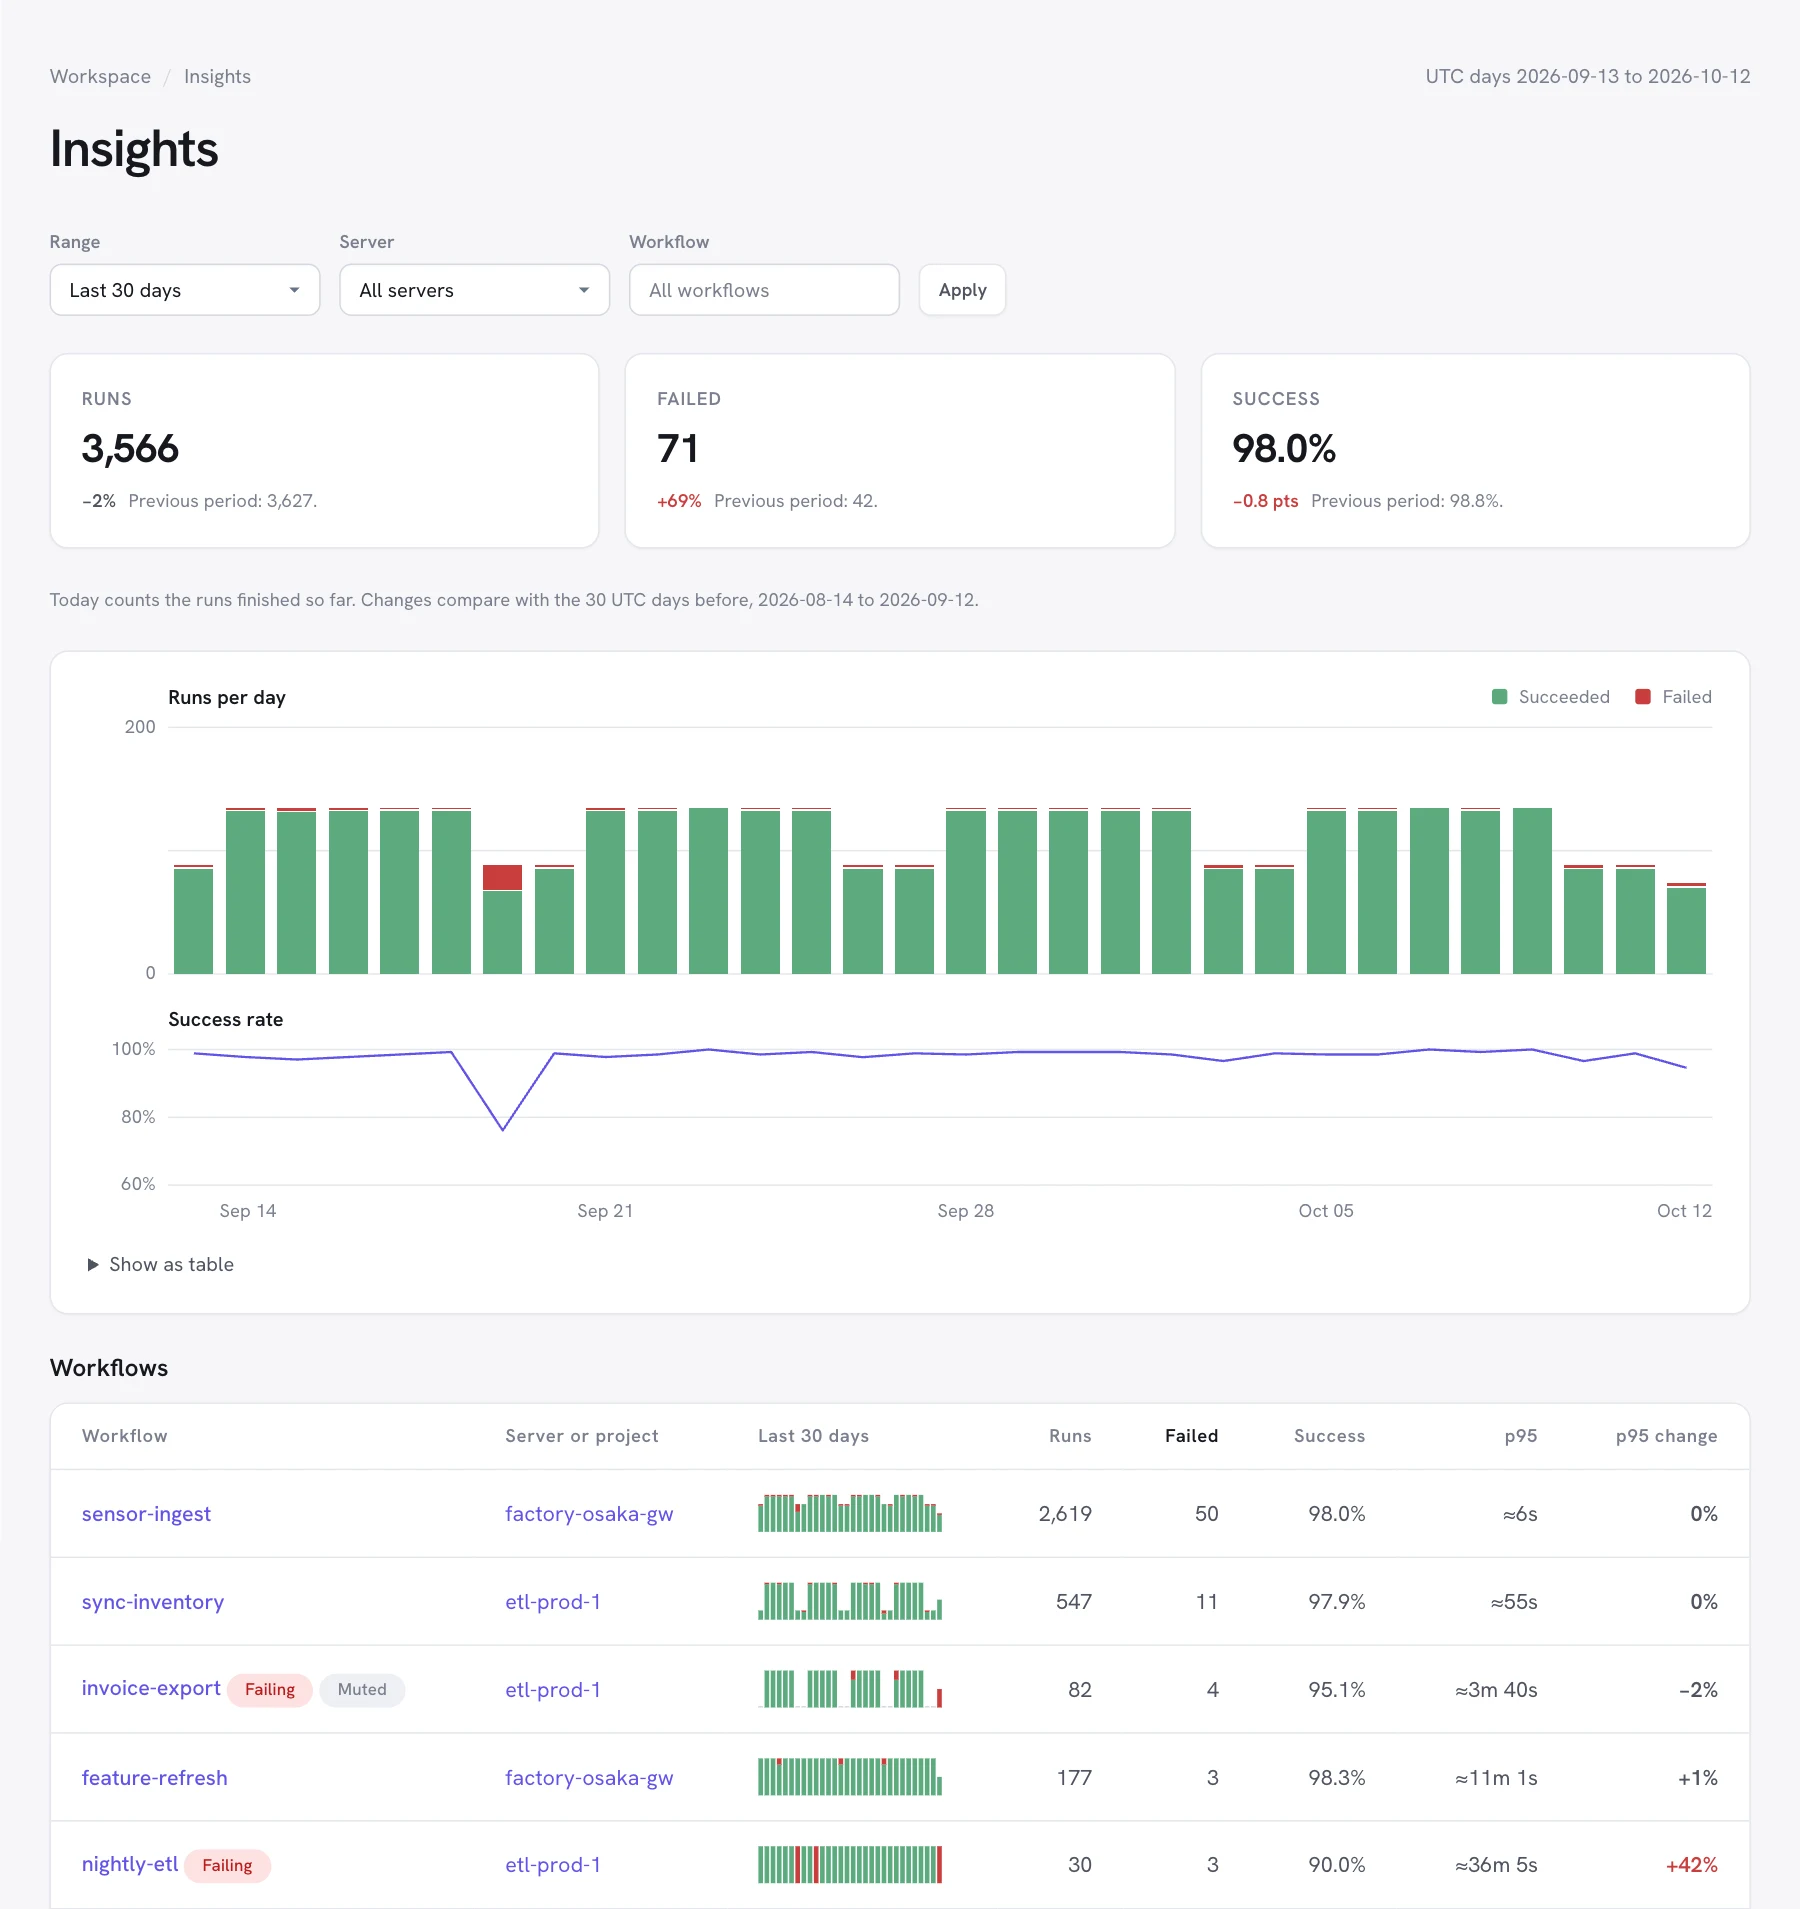
Runs, failures, and success rate against the previous period, runs per day, and every workflow with its p95 duration and how it changed. Today's runs count as they finish.
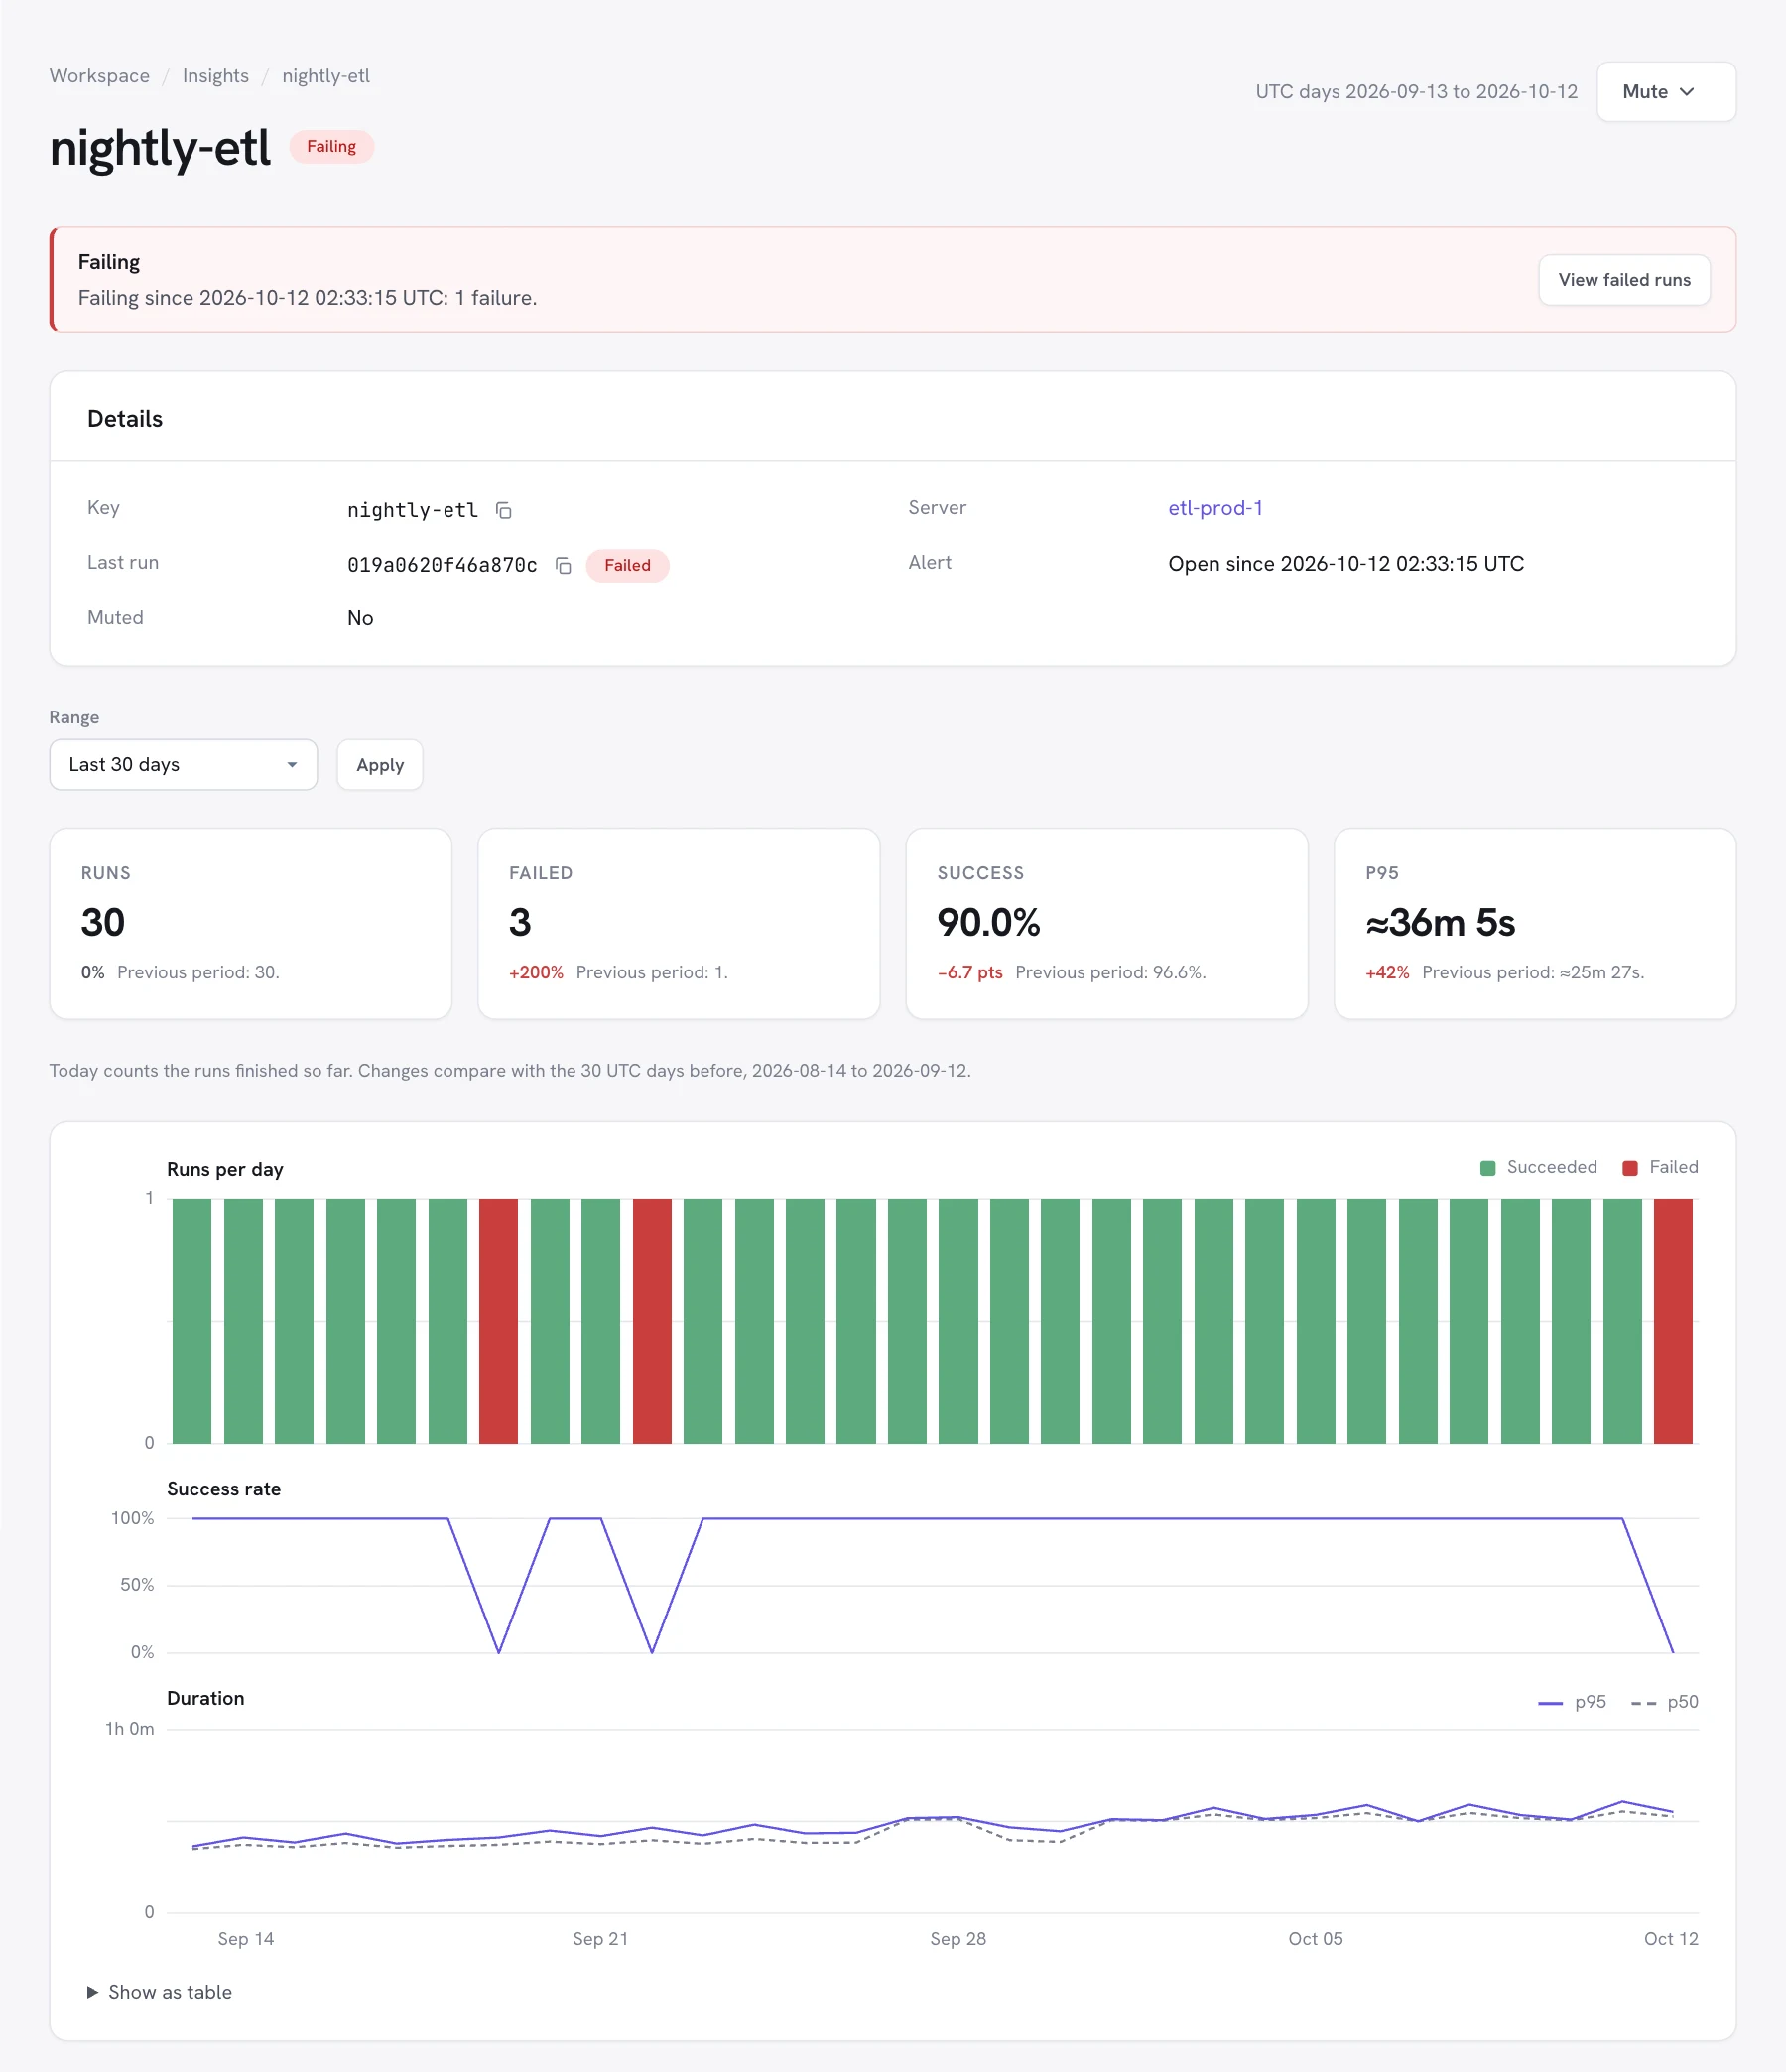
A page per workflow with its open alert, runs per day, success rate, and p50 and p95 duration over 7, 30, or 90 days, plus its recent runs and the steps it failed at. Owners can mute it here.
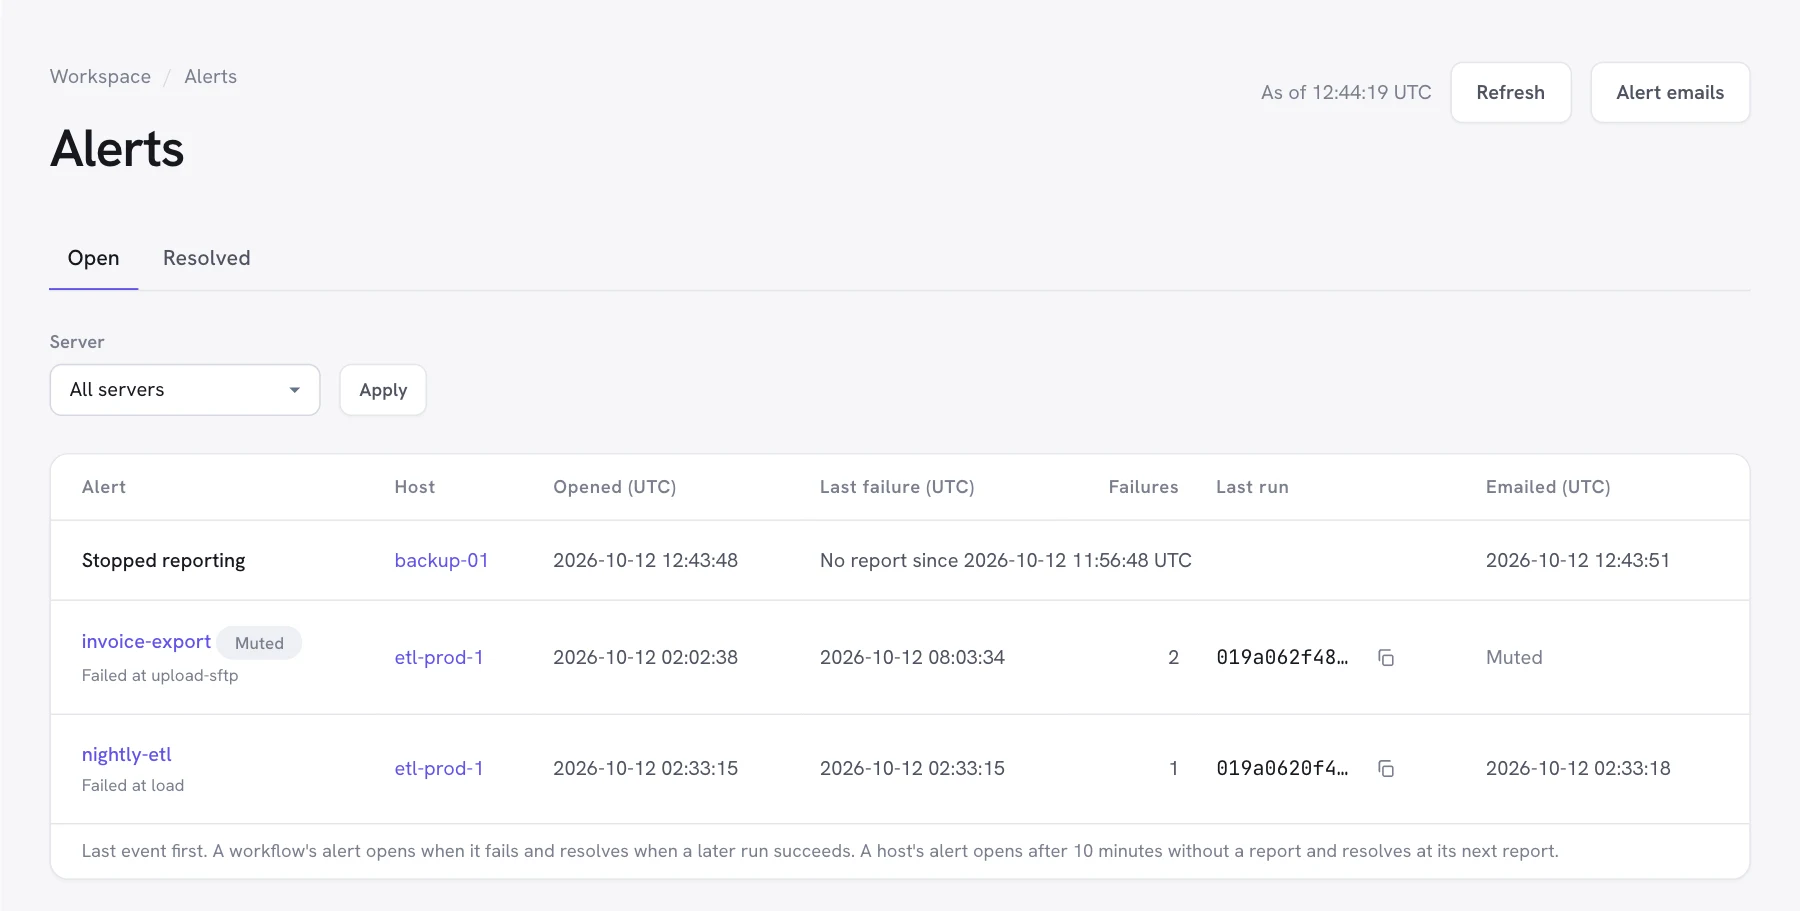
An alert belongs to one workflow on one server. It opens when a run fails, counts later failures, and resolves when the workflow succeeds again.
Workflow alerts need the Health and run status level. Emails come from no-reply@dagu.sh.
Your servers send reports to Dagu Console. Dagu Console never connects to them and never runs workflows.
Reports are HTTPS requests from the server to console.dagu.sh. No inbound port is opened, and nothing connects into the server.
If Dagu Console cannot be reached, workflows run as usual. The server retries and sends the runs it missed once the console is back.
Monitoring is off by default and chosen per server by its administrator. Connecting or upgrading a server sends nothing beyond its license check-in.
Health only sends what the server runs. Health and run status adds the status of its runs, and is needed for workflow alerts.
Dagu version, OS and architecture, and when the server process started
Number of running schedulers and registered coordinators
Each finished top-level run: DAG name, run ID, attempt ID, status, trigger, and when it was queued, started, and finished
Names of a run's failed steps, up to 50
Runs queued, running, or waiting, up to 200 per report
Logs, outputs, parameters, environment, step commands, DAG YAML, secret values, and error messages
Every report also carries the server's license ID, server ID, and heartbeat secret, as its license check-in does. DAG and step names are sent only with run status; choose Health only if you consider them sensitive.
Requires Dagu v2.19.1 or later (v2.19.2 or later for free monitoring), and the server must reach https://console.dagu.sh over HTTPS.
In Dagu, open Plan & features and select Connect to Dagu Console, run dagu license activate, or start the server with a server key. Servers with offline licenses do not report.
Select Turn on in the Monitoring section of Plan & features, then choose Health and run status or Health only. The choice applies at once, without a restart.
For servers managed as code, set the level in the configuration file, or set DAGU_CLOUD_REPORT=runs:
cloud:
  report: runs   # off, health, or runs
The server reports every 60 seconds, and within about 5 seconds when a run fails or the runs in progress change. It appears under Monitoring in Dagu Console.
Monitoring is in beta. Retention periods and limits may change during the beta.
Free for one server per workspace, with lower limits: a report every 5 minutes, 100 stored runs a day, 7 days of run history, and alerts to owners and admins. Team and Pro cover every licensed server.
Compare plansA server that sends no report for 30 days is removed from monitoring, with its daily totals and alerts.
Each workspace stores up to 500 finished runs per UTC day, or 100 on free monitoring. Runs past the limit still count toward the daily totals and still open and resolve alerts, but they are not added to the run list. Storing resumes at 00:00 UTC.
Need more? Contact usRead the setup guide, or open Dagu Console and connect your first server.