Engineering
Monitoring Dagu servers without seeing their logs
A hosted monitor for self-hosted servers has to answer one question before any other: what leaves the server? How Dagu's reporter decides, survives outages without losing or repeating a run, and tells silence from failure.
TL;DR A Dagu server sends Dagu Console metadata only, and only after its administrator chooses to. It reads its own event log from a cursor that moves only when the console confirms what it stored, so an outage loses nothing and repeats nothing. The console alerts on silence, but not when the silence is more likely its own fault. Logs, outputs, parameters, and secrets never leave the server.
People run Dagu on their own servers for a reason. The workflows sit next to the network, the credentials, and the data they work on, and nothing about running them depends on a service somewhere else. A monitor for those servers that wanted their logs would undo the reason they exist.
So the design of monitoring in Dagu Console did not start from what the console should show. It started from what the console must never see, and worked outward. This post walks through the decisions, mostly from the connector RFC, with the reasons behind them.
Start from what never leaves
These are never sent, at any level: logs, outputs, parameters, environment variables, step commands, DAG YAML, the values of secrets, and error messages.
The last one is the hardest to leave out. An alert email that says connection refused to db-02:5432 is more useful than one that says a step named load failed. But error text is exactly where hostnames, file paths, and fragments of data end up. For now, the failed step's name tells you where to look, and your server tells you why. Whether error text should ever be its own explicit choice is still an open question in the RFC, and I would rather leave it open than guess.
What is sent depends on a level the server's administrator chooses:
| Level | Sends |
|---|---|
| Off (default) | Nothing beyond the license check-in |
| Health | The Dagu version, OS and architecture, when the process started, and how many schedulers hold the scheduler lock and how many coordinators are registered |
| Health and run status | Also each finished run once: its DAG name, run ID, attempt ID, status, trigger, and times, and the names of its failed steps; and the runs queued, running, or waiting |
DAG names and step names are the most revealing thing on that list, so they come only with run status. An administrator who considers them sensitive picks Health and still learns when the server or its scheduler stops.
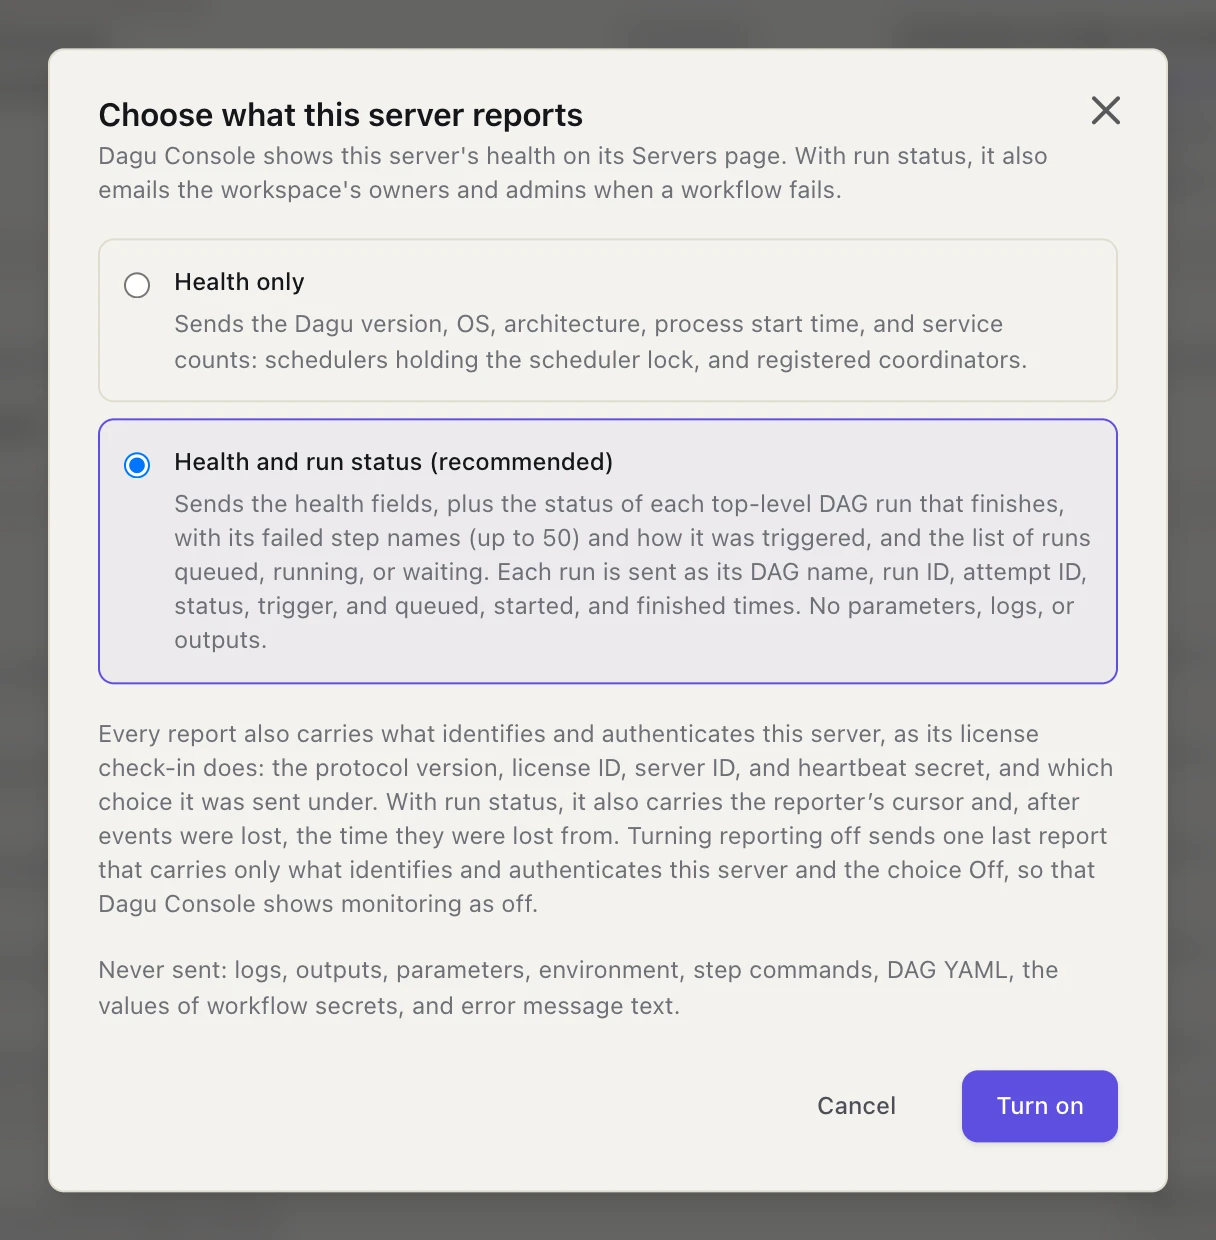
Three rules sit around the levels:
- Nothing changes on its own. Upgrading Dagu, or connecting a server to the console, sends nothing new. The level starts at off. The dialog that offers the others lists what each one sends, and what is never sent, before anything goes out.
- The server decides. The console cannot turn reporting on or change what a server sends. For servers managed as code,
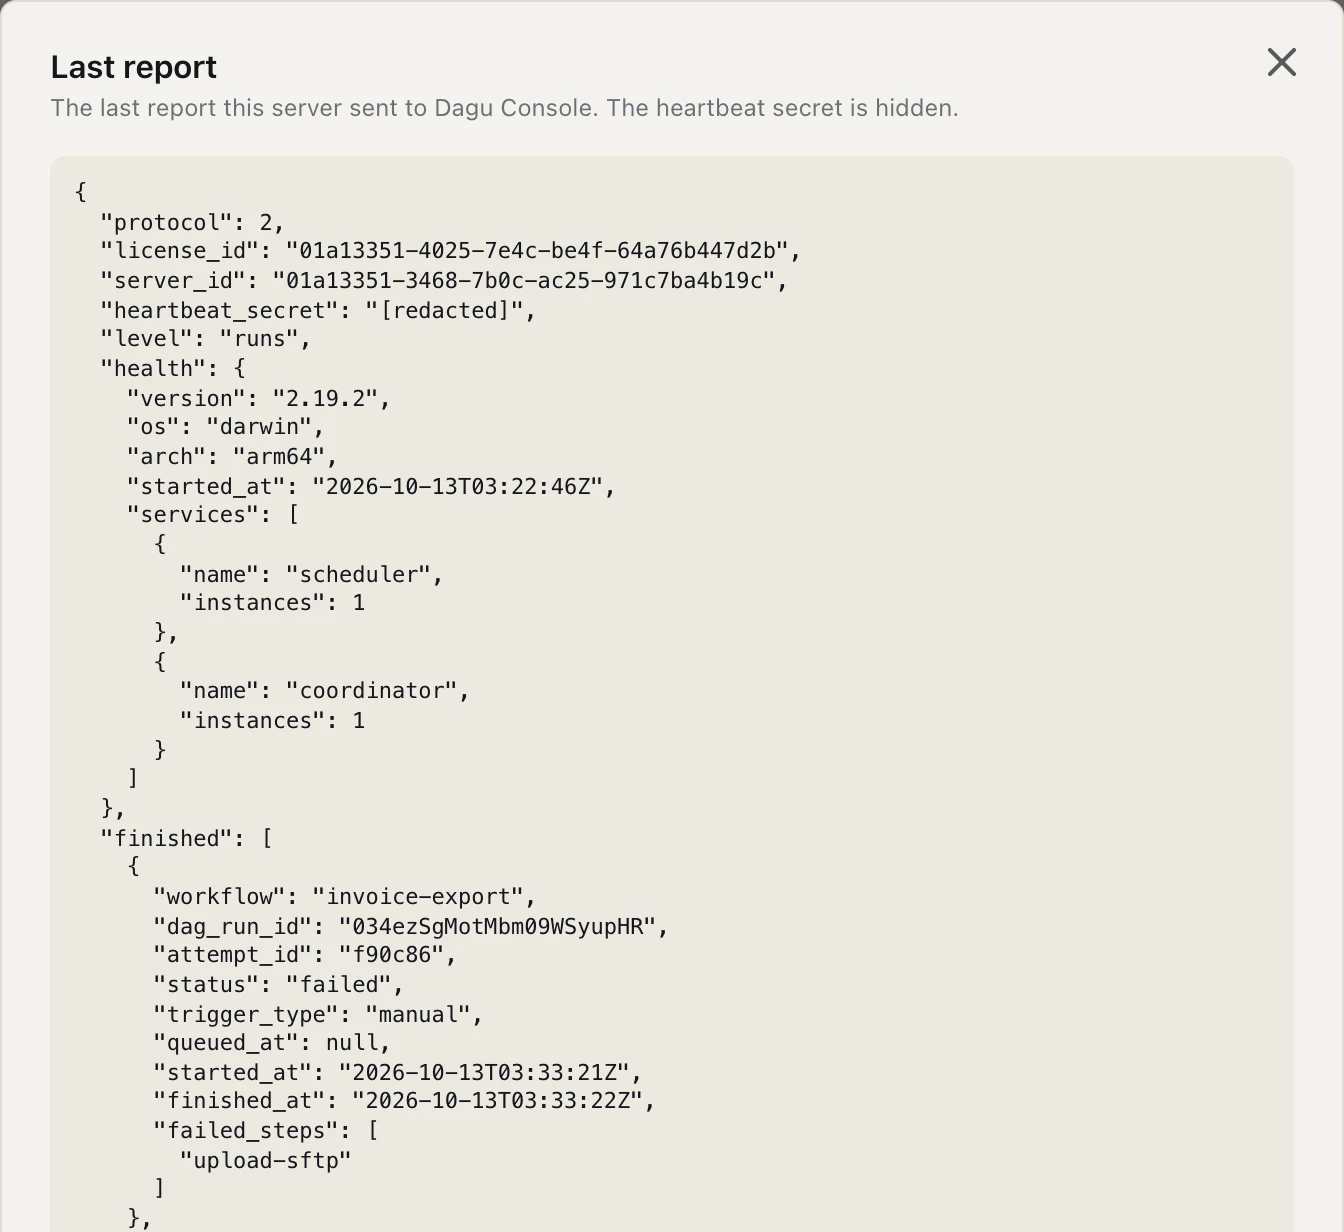
cloud.reportin the configuration fixes the level, and the web UI shows it read-only. - You can check. Plan & features shows the exact JSON of the last report, with the heartbeat secret hidden.
That last rule is the one I care about most. A privacy claim you cannot verify is a promise. A report you can read is a fact. Here is the start of one, from a server at Health and run status:
Outbound, on the license's credentials
A server reports with one HTTPS request: POST /api/v1/servers/report, authenticated with the same credentials as its hourly license check-in. Nothing connects into the server. There is no agent to install, no inbound port, and no VPN.
I considered carrying reports over a long-lived WebSocket instead, since remote access, planned in the same RFC, will ride a connection the server opens. One connection for everything is tidy. It also means every reporting server holds open a channel that can carry requests into it, whether or not anyone turned remote access on. A short POST that can only carry data out is a smaller thing to trust.
Workflows never wait on any of this. If the console cannot be reached, the reporter backs off up to five minutes and tries again, and every workflow runs exactly as it would have.
Every run once, even when the network is not
The interesting part is not sending a report. It is sending each finished run exactly once across restarts, outages, and processes that share a data directory.
Dagu already writes every run's status changes to an event store on disk. The reporter does not keep its own copy of anything. It reads that event log from a cursor, sends the runs that finished after it, and moves the cursor only when the console's response acknowledges the same cursor it was sent:
Dagu server                                   Dagu Console

event store ──▶ reporter ── POST report ────▶ stores each run once,
                   ▲     {finished…, cursor}  by server, run, attempt
                   │                                    │
                   └───────── {ack: cursor} ◀───────────┘
        saves the cursor only on this ack
If the request times out after the console stored the runs but before the response arrived, the reporter sends the same runs again. That is harmless: the console stores each finished run once, by server, run ID, and attempt ID, and applies a workspace's reports one at a time, so two reports racing each other cannot both insert the same run. The RFC's acceptance criterion for this is blunt: two hours without a network, then reconnecting, must lose no run and repeat no run.
Two details keep the cursor honest:
- One reporter per data directory. Several Dagu processes can share a data directory. A lease across processes lets one of them send runs, while each sends its own health, so no two processes send the same run.
- Gaps are reported, not guessed. The event store keeps one day of events by default. A server cut off for longer has lost the events in between, and no amount of cleverness gets them back. The reporter notices that its cursor is older than what the store still holds, carries on from the newest event, and tells the console from when events were lost. The console shows Events lost for that server instead of an empty stretch that looks like a quiet day.
Consent applies to the past too. If an administrator turns run status off and later on again, the reporter first moves its cursor to the newest event. Choosing to report runs never sends the runs that finished while reporting was off.
Runs in progress
Finished runs are an append-only log, so a cursor fits them. Runs in progress are a set that changes, so each report carries the whole set instead: up to 200 runs queued, running, or waiting, the most recently started or queued first, and a count of all of them. Each report's list replaces the one before.
After a gap, or on a server that has no saved list, the reporter does not know that set, so it rebuilds it from the run history in the background. Until then, reports leave the list out entirely. That difference matters: an empty list says nothing is running, and a missing list says nothing at all. The console would rather show nothing than show a confident zero.
The console applies the same caution to runs it already holds. When a server stops reporting, its runs in progress show as unknown, because any of them may have ended unseen.
Every minute, sooner when it matters
A server reports every 60 seconds, and early, within about five seconds, when a run fails, is aborted, or is rejected, or when the runs in progress change. Early reports come at most every five seconds. Below, in real time, a run fails on a server, and the server's Runs tab in the console shows it within seconds.
Many workflows start at the top of the hour, so the reporter avoids marching in step with every other server:
- the first report after Dagu starts waits a random zero to 60 seconds;
- every interval varies by up to 10 percent;
- an early report waits a random zero to five seconds after the change that triggered it.
The console can always ask for less. Each response says when to report next, and a report that comes too soon gets 429 with Retry-After. The reporter honors both and keeps its cursor, so slowing down delays runs but never drops them. Once a report is throttled, rejected, or fails, nothing is sent early until one is accepted, so a struggling console is not met with more traffic. Servers on the free tier are told to report every five minutes, and the console takes early reports from them at most once every 30 seconds. It is the same mechanism.
Telling silence from failure
A server that stops reporting raises no error. That is the case monitoring exists for, and it is also the easiest one to get wrong.
Every minute, a scheduled tick looks for servers that went quiet. A lease in the database lets one tick run at a time, however many instances of the console serve. A server silent for ten minutes, or for five of its report intervals if it was told to report less often, opens a stopped-reporting alert and emails its recipients. Its next report closes the alert, and that email says how long it was silent.
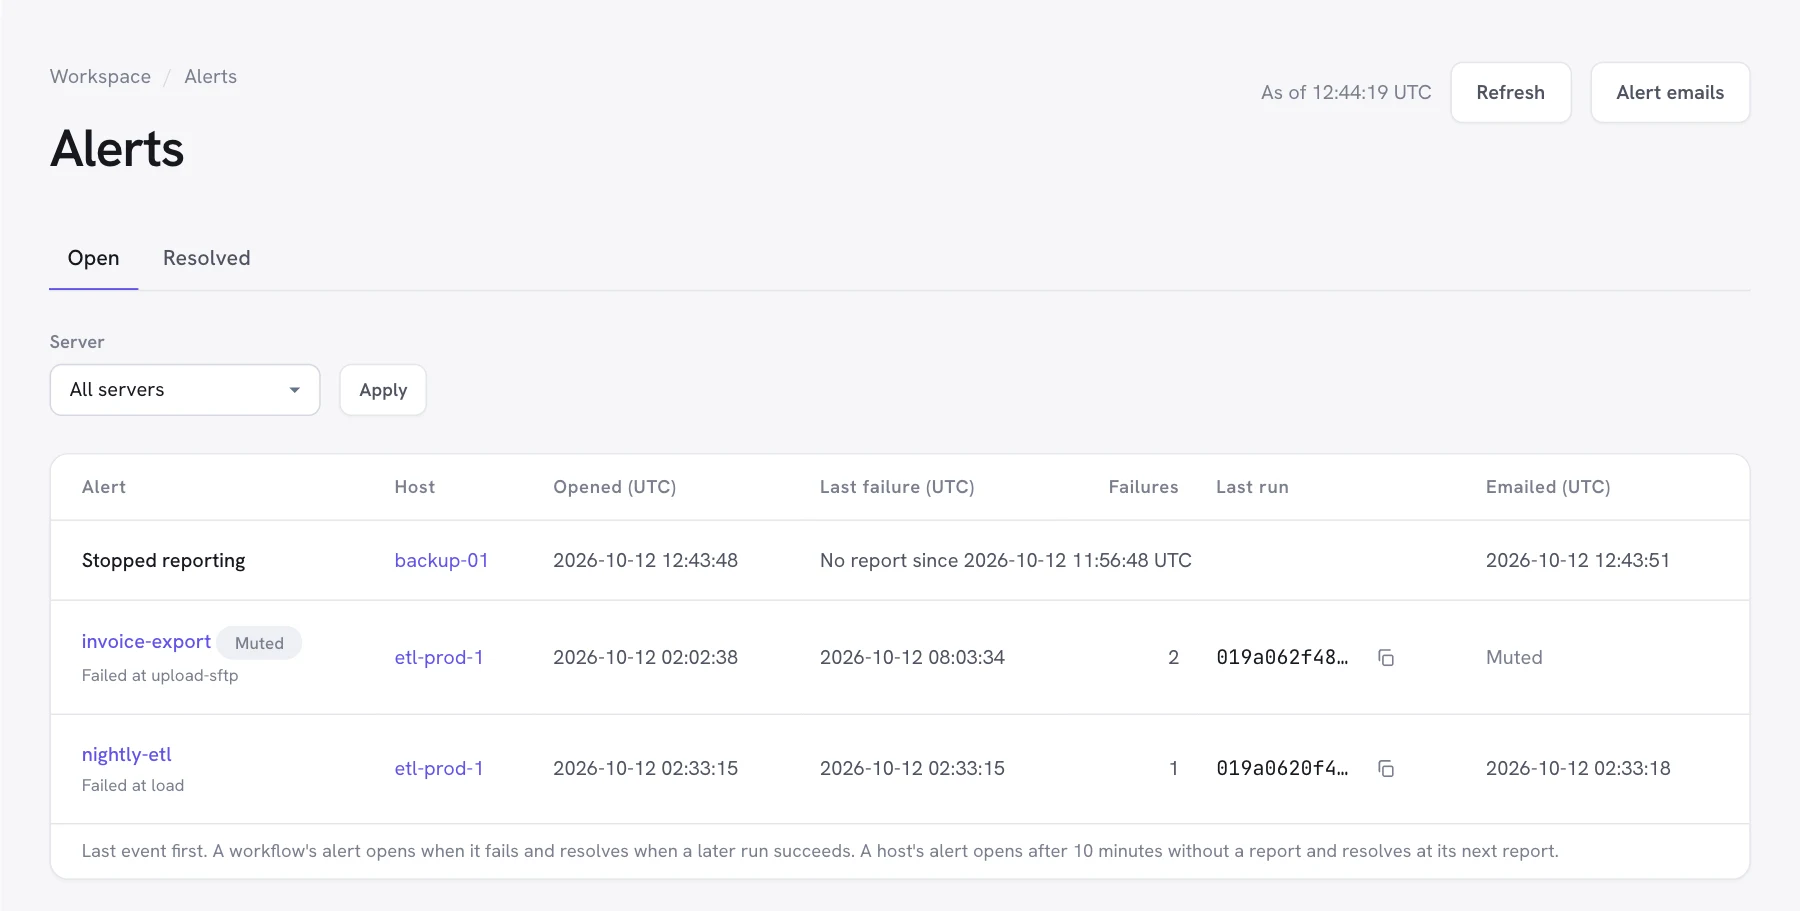
Most of the work goes into not crying wolf:
- Turning monitoring off is not an outage. When an administrator turns reporting off, the server sends one last report that says so, carrying nothing but its identity. The console shows Monitoring off and opens no alert.
- The console's silence is not the server's. If ten or more servers go silent in the same tick, and they are at least 30 percent of the servers being watched, it is far more likely that the console lost them than that they all failed at once. The tick logs it and opens nothing. The failure I most wanted to avoid was emailing every customer at once about a problem on our side.
- Time the console was not watching does not count. If the ticks themselves stopped for more than three minutes, silence is measured from the first tick after they resumed.
- Gone is not silent. A server that has not reported for 30 hours is no longer watched, so one retired long ago never opens an alert.
Workflow failures get the same treatment. A failed run opens one alert for its workflow; further failures add to that alert instead of opening new ones, and a later successful run resolves it. Alerts that open or resolve together arrive in one email.
Trends without keeping the runs
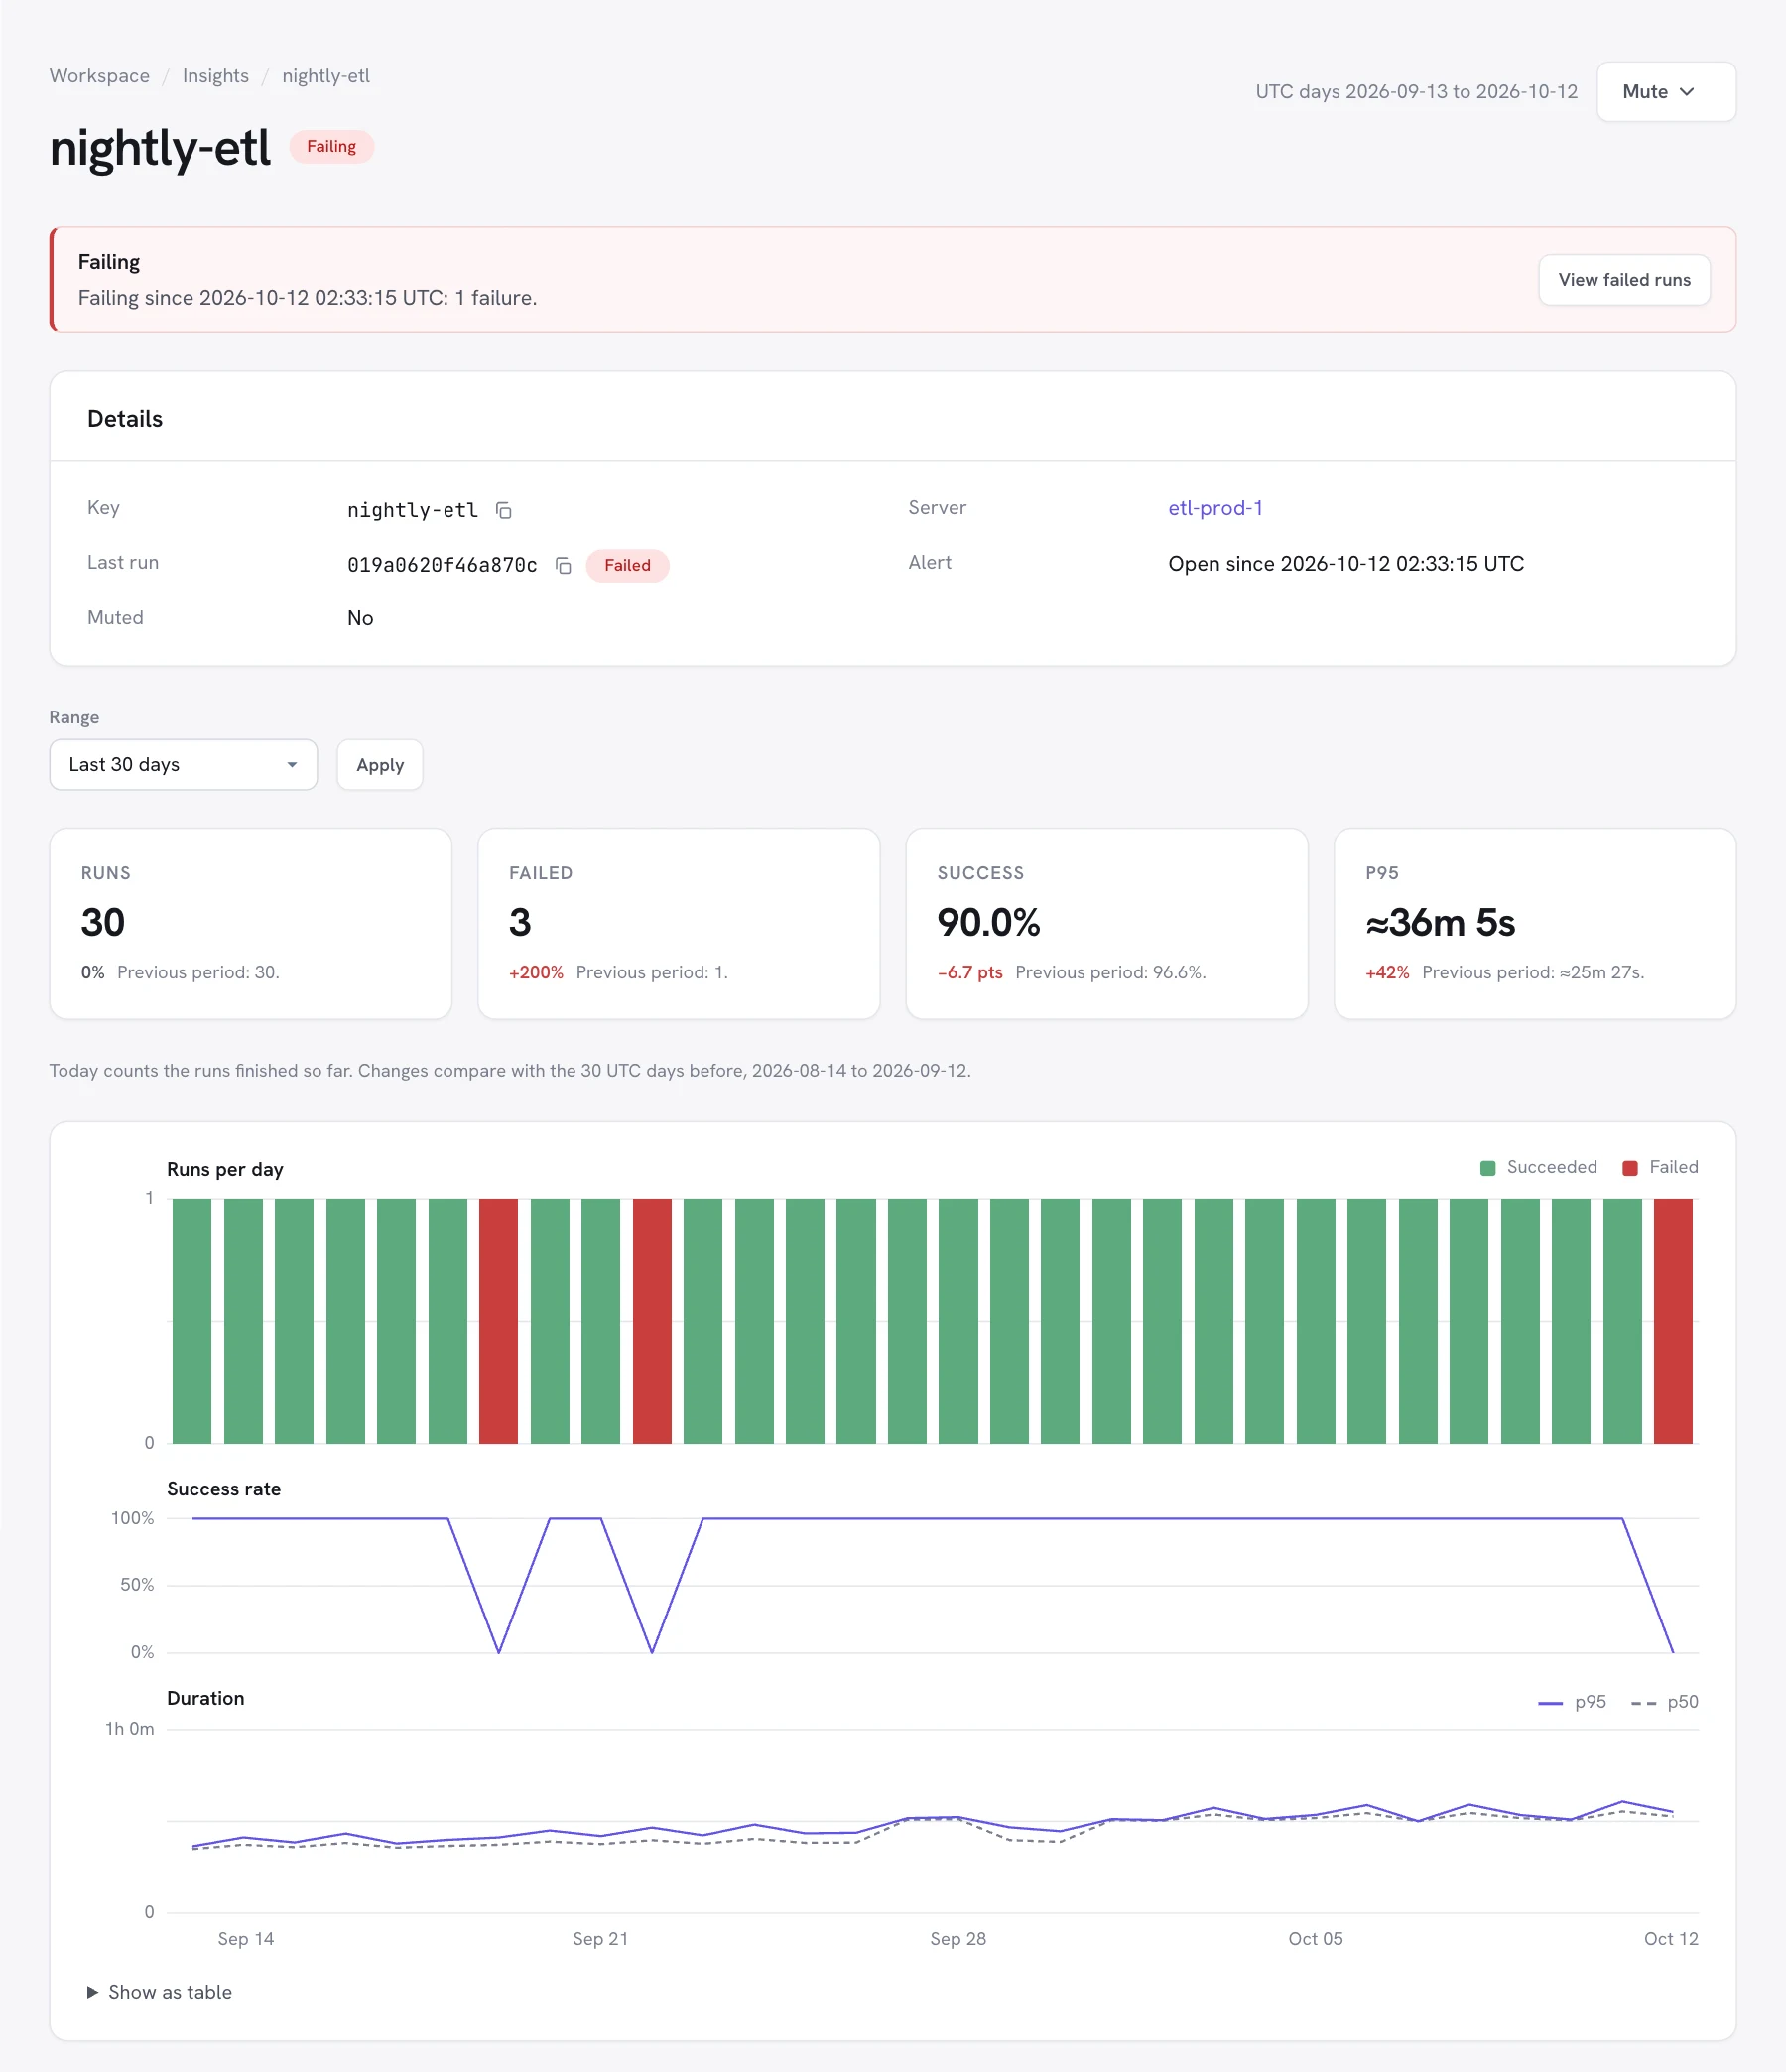
Finished runs are kept for 14 days, in one database partition per UTC day, so expiring a day is dropping a table rather than deleting rows. Insights, though, covers up to 90 days, and the daily totals behind it are kept for 13 months. There are no runs to compute a p95 from.
Each workflow keeps, per UTC day, how many runs succeeded and failed, the longest run, and how many runs fell into each of 16 duration buckets. Their lower bounds are 0, 1, 2, 5, 10, and 30 seconds; 1, 2, 5, 10, 20, and 30 minutes; and 1, 2, 4, and 8 hours. A p95 over 30 days adds up those buckets, finds the one that holds the 95th percentile, and interpolates inside it, geometrically, since the bounds grow by ratio. The estimate never exceeds the longest run actually seen. The console shows it with ≈ in front, because it is an estimate.
The buckets can never change. A day already counted under one set of bounds would mean something else under another.
The trade
Reporting is off until someone turns it on, so fewer servers report than would if it were on by default. That was a deliberate trade. Every server that does report sends only what its administrator chose, and its administrators can read exactly what that was.
The monitoring docs list everything a report carries, field by field, and the RFC has the full wire contract. Both are public for the same reason the last report is one click away on the server: the claim that your logs stay home should be something you can check, not something you take on trust.
Written by
Contributor to the Dagu project.
More from Yota Hamada